Dougal,
How do you determine how much fuel the pump delivers at full load at each pump speed. Rack position doesn't correlate to pumped volume as I understand it, as pumping efficiency increases at higher pump speeds.
From the pump calibration data I posted earlier - Point A (rack position R1, or 11.9mm) supplies 77mm^3 / stroke (or 77cc/1000 strokes). Point B on the other hand (rack position R1-0.15, or 11.75mm) supplies 79cc/1000 strokes. Is there a way to convert rack position and pump speed data into a volume of fuel delivered at full load?
My pump has a big red 180cc written on it, although the text in Katakana next to it I understand says something about engine oil (my better half didn't understand the Kanji characters).

Anyone know what this refers to? Oil flow required for initial lubrication or max fuel flow?
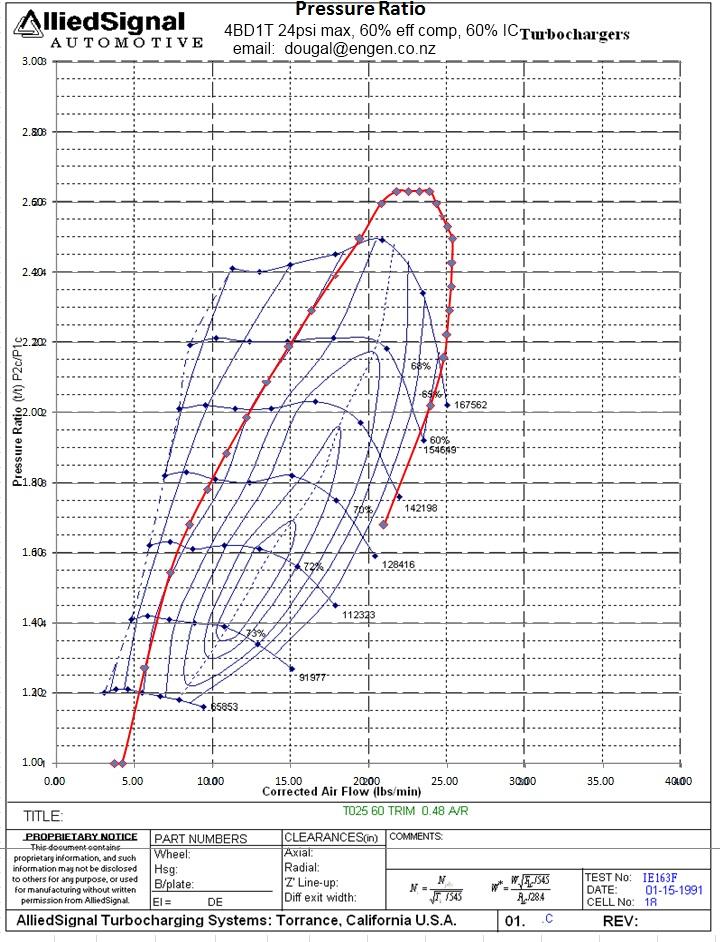
Also with regard to the turbo, does exceeding maximum shaft speed (i.e. moving off the compressor map upwards) have significant consequences for turbo longevity? I assume the interrupted efficiency islands generally follow the shape of the ones that fit on the graph.


 Reply With Quote


")

Bookmarks